This page examines the sound of the cello. Several simple experiments were performed, including playing open strings and the fingered notes of the same frequency, changing the bow-string contact point to change the tone color, and playing a chromatic scale and measuring the amplitude to get a feel for the instrument's frequency response. The experiments and results are simple, but give some basic insight into the cello sound. The harmonics were measured using Harmometer, a free program I wrote.
This brief introduction presents the idea of harmonic analysis. The pitch of a note is determined by its frequency, that is, how many times per second the pattern of the waveform repeats. A pure sine wave tone is shown below. The picture shows four repetitions of the basic pattern of a sine wave.

A pure sine wave
More complicated sounds can be formed by adding harmonics. Harmonics are also known as partials or overtones. A harmonic is a pure sine wave which has a frequency that is an integer multiple of the fundamental frequency. For example, if you have a tone at 100 Hz (100 cycles of the wave pattern per second), the first harmonic would be at 200 Hz, the second harmonic would be at 300 Hz, etc. The following picture shows a waveform consisting of the fundamental and first harmonic. This shows how complex wave shapes can be built up using a sum of pure tones.

2 sine waves added together
The relative amplitude (graphically, the height) of each harmonic component is what determines what a tone sounds like. The strength of the harmonics is what makes the difference between a gentle tone and a harsh tone. Below is a picture of a synthesized cello sound composed of the fundamental plus 10 harmonics. Although the waveform looks complex, it is made up of pure sine waves added together.

Computer synthesized cello tone
Mathematically, any periodic (repetitious) waveform can be generated by adding an infinite number of pure sine waves, which is called a Fourier series. Below is a picture of real cello sound recorded with a microphone. You can imagine that this waveform is actually made up of pure sine waves added together (the fundamental plus all the harmonics).

Real recorded cello tone
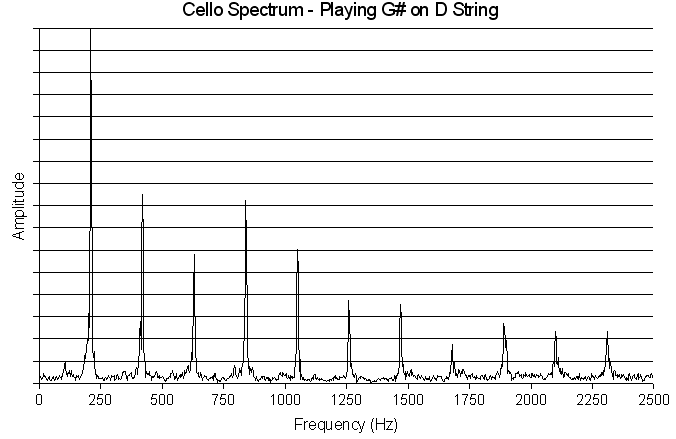
The graph below shows a portion of the spectrum of a cello tone. Note the strong, evenly-spaced peaks. Those peaks are the harmonics. By measuring the amplitude of the harmonics, one can gain insight into the tone quality.

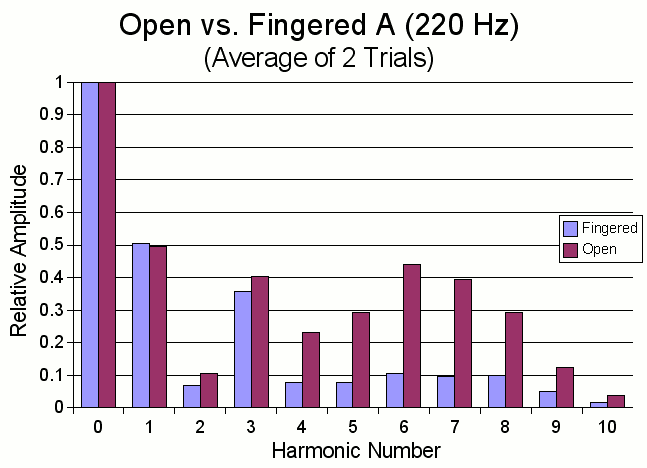
In this study, the open A string was compared to the same note, A (220 Hz) played on the D string. The graph below shows the strength of the harmonics relative to the fundamental. For convenience, the fundamental is labeled harmonic 0.

What can we learn from this graph? Notice that the first three harmonics are almost the same strength for the open and fingered notes. But for the higher harmonics, harmonic 4 and up, the amplitude of the harmonics is dramatically greater for the open string. This explains why the open string has a brighter, somewhat harsher sound than the same note played fingered.
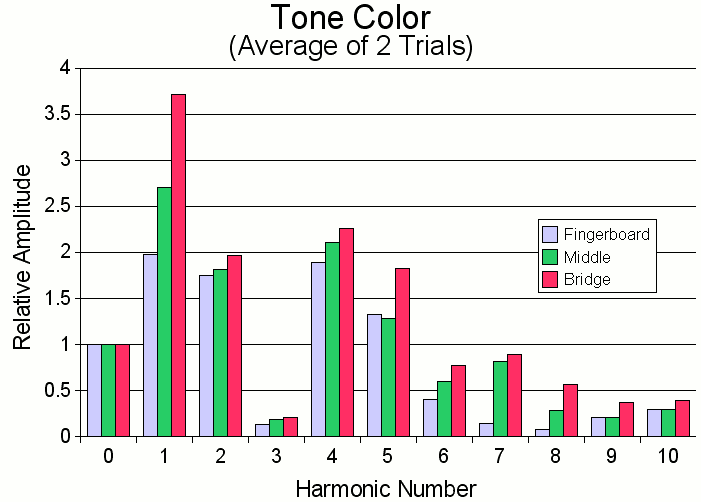
In the second study, the contact point between the bow and string is changed. Playing over the end of the fingerboard gives a gentle sound, while playing right next to the bridge gives a harsher, brighter sound. The graph below shows how this fact is reflected in the harmonics. The graph below shows the strength of the harmonics relative to the fundamental. The bars labeled "fingerboard" were played over the end of the fingerboard, while the bars labeled "bridge" were played very close to the bridge.

These results are similar to the results from the open string vs. fingered note study. Stronger (higher amplitude) harmonics are clearly associated with a brighter tone. The tone when playing near the fingerboard sounds "purer", and the graph shows that this is actually true—the tone is closer to being a pure sinusoid because there is less of the harmonics.
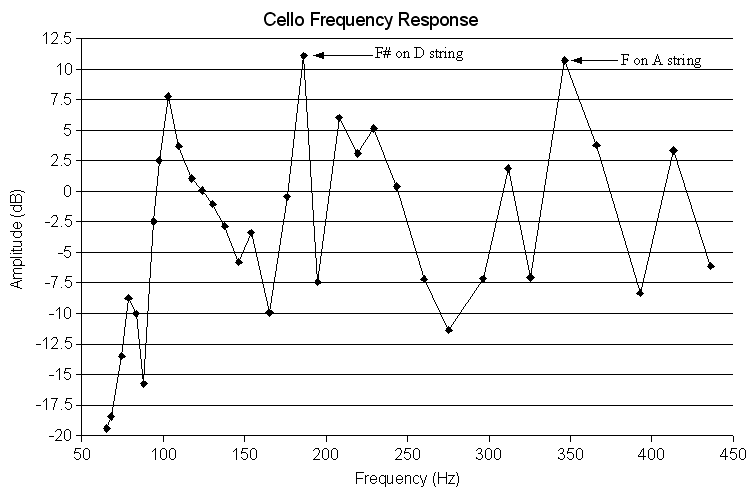
In the third study, the frequency response of the instrument is measured. "Frequency response" is the variation of amplitude as the frequency changes. For this test, a chromatic scale was played as loudly as possible and the amplitude of the fundamental of each note was measured. In audio equipment, a flat, linear frequency response is desirable. However, as the graph below shows, the frequency response of the cello is anything but linear.

At first, the graph may appear somewhat random. However, at least two important observations can be made. First of all, you can see that for this student-grade instrument the amplitude of the lower notes is significantly less than the rest of the notes on the instrument. The first 6 data points, corresponding to the C string, are all less than -7.5dB. (Note: Here decibels are taken relative to the average amplitude, meaning that the average amplitude is 0dB). The second observation that can be made is that the wolf tones are clearly noticeable. The note F# on the D string has the highest amplitude of any note on the instrument, being at 11.1dB greater than average. The second highest amplitude note is F natural on the A string.
Comments and questions are welcome. E-mail address: contact delete-this-before-sending _AT_ vobarian.com (Obviously, delete the extraneous words and replace _AT_ with @. This is to reduce spam.)
Mountains & clouds at top of page (clouds.jpg) taken from photo by Oswald Skene / DHD Multimedia Gallery
©2009 Chad Berchek - everything here unless otherwise noted